CLARISITY strongly believes that BI and Analytics are an integral part of the customer’s corporate culture to gain strategic level insights that drive Action. CLARISITY’s Data and Analytics capabilities deliver better business results for our customers in Data Collection, Consumption, and Application.
Enterprises are moving from historical reporting to Forecasting and Forward planning. CLARISITY BI/Analytics experts help customers Automate their Reporting, Build Insightful Dashboards and Develop Predictive Models to ensure customer have insightful Data and Analysis to make accurate and fast decisions.
Our offerings include…
Data Integration & ETL
- We help Integrate Data from multiple sources and organize them into a single repository after required cleaning and transformations. Having a unified view of data from various sources simplifies Data Analysis and increases Efficiency.

Data Warehouse
- We help Build Data Warehouse for storing of Structured, Processed, and refined data. This data can then be for Reporting & Analysis.

Data Analytics
- Our Data Analytics Services help you generate actionable insights from your data and respond to them. Through Data Analytics, businesses can identify underlying patterns, relationships and trends.

Data Visualization
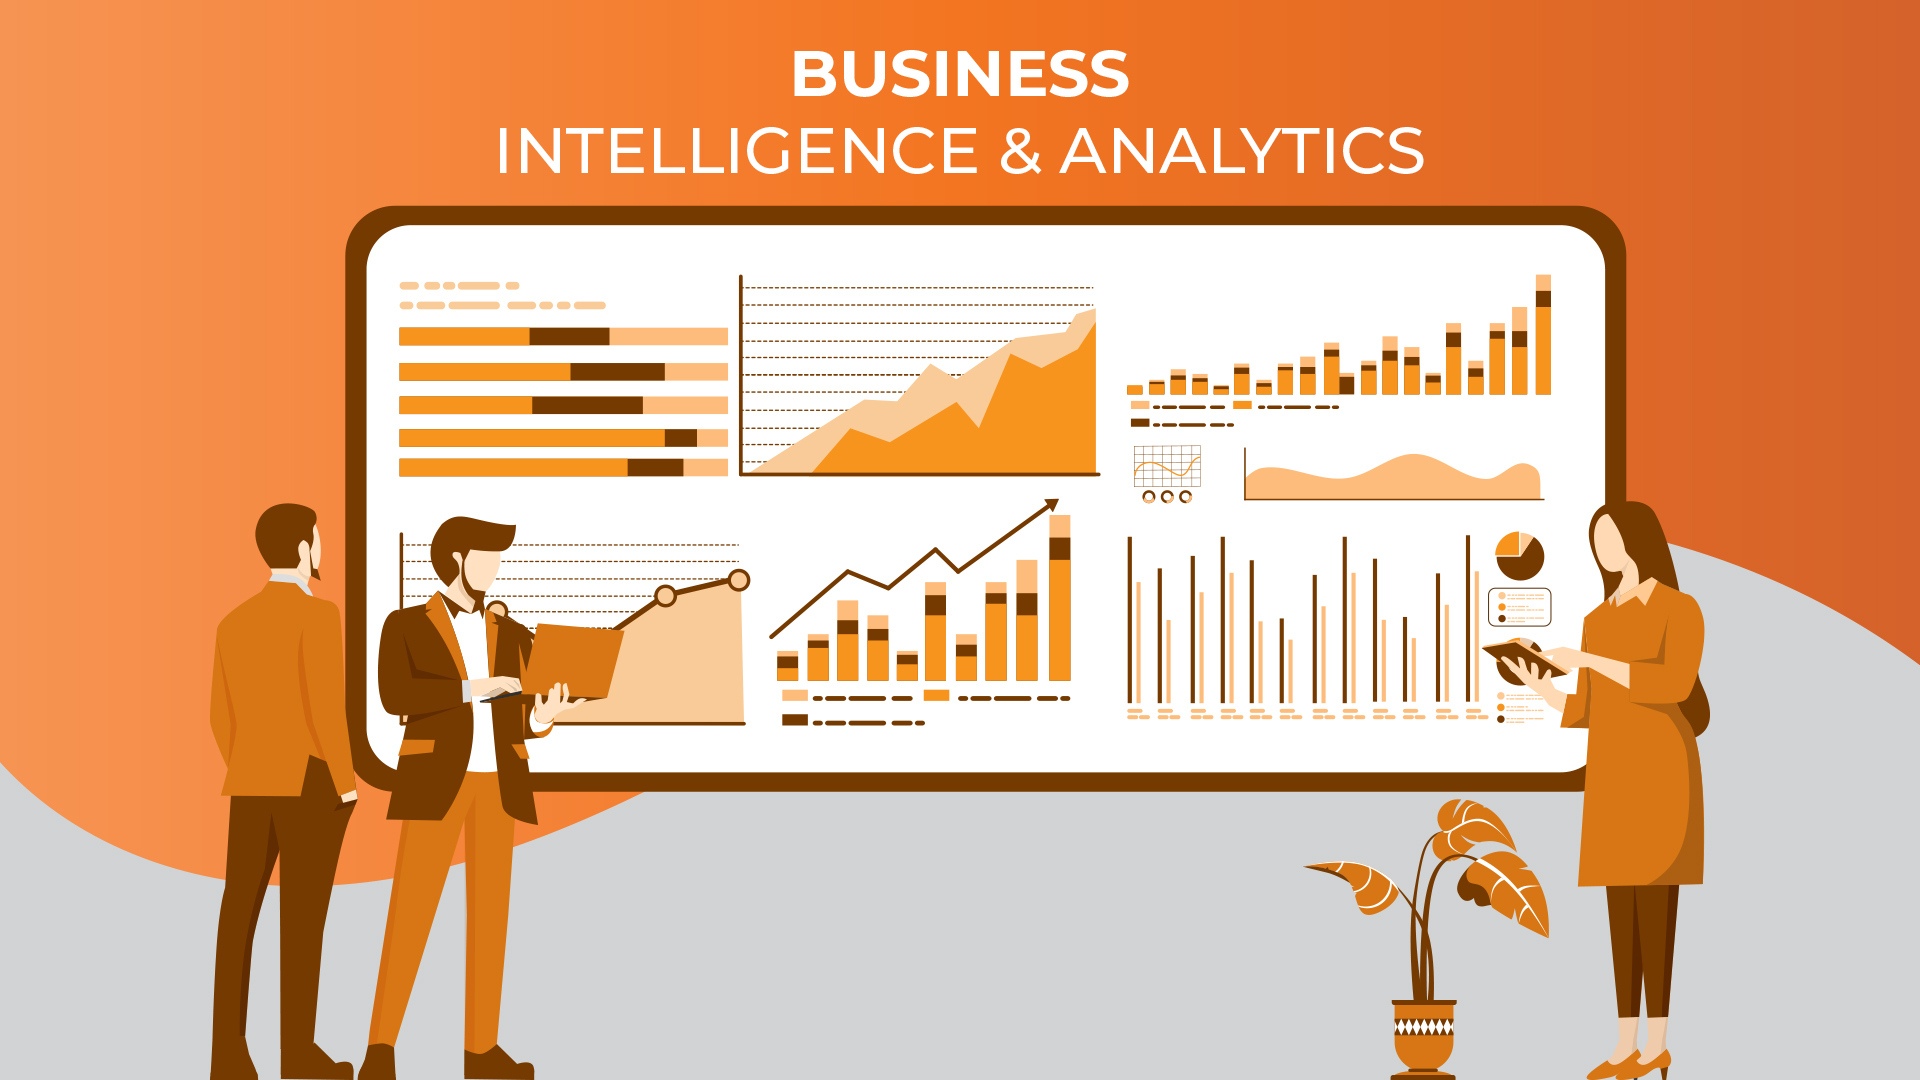
- We use industry-leading solutions to Analyse and Visualise large volumes of data. Highly interactive visualizations and dashboards help you comprehend and draw insights from complex data.

Business Intelligence
- We offer a wide range of Business Intelligence services enabling organisations to make data-driven decisions that reduce costs, improve efficiency, and accelerate their growth.

Data Science
- Advanced Analytics of Data using Statistics, scientific computing, scientific methods, processes, algorithms and systems to extract or extrapolate knowledge and insights from noisy, structured, and unstructured data

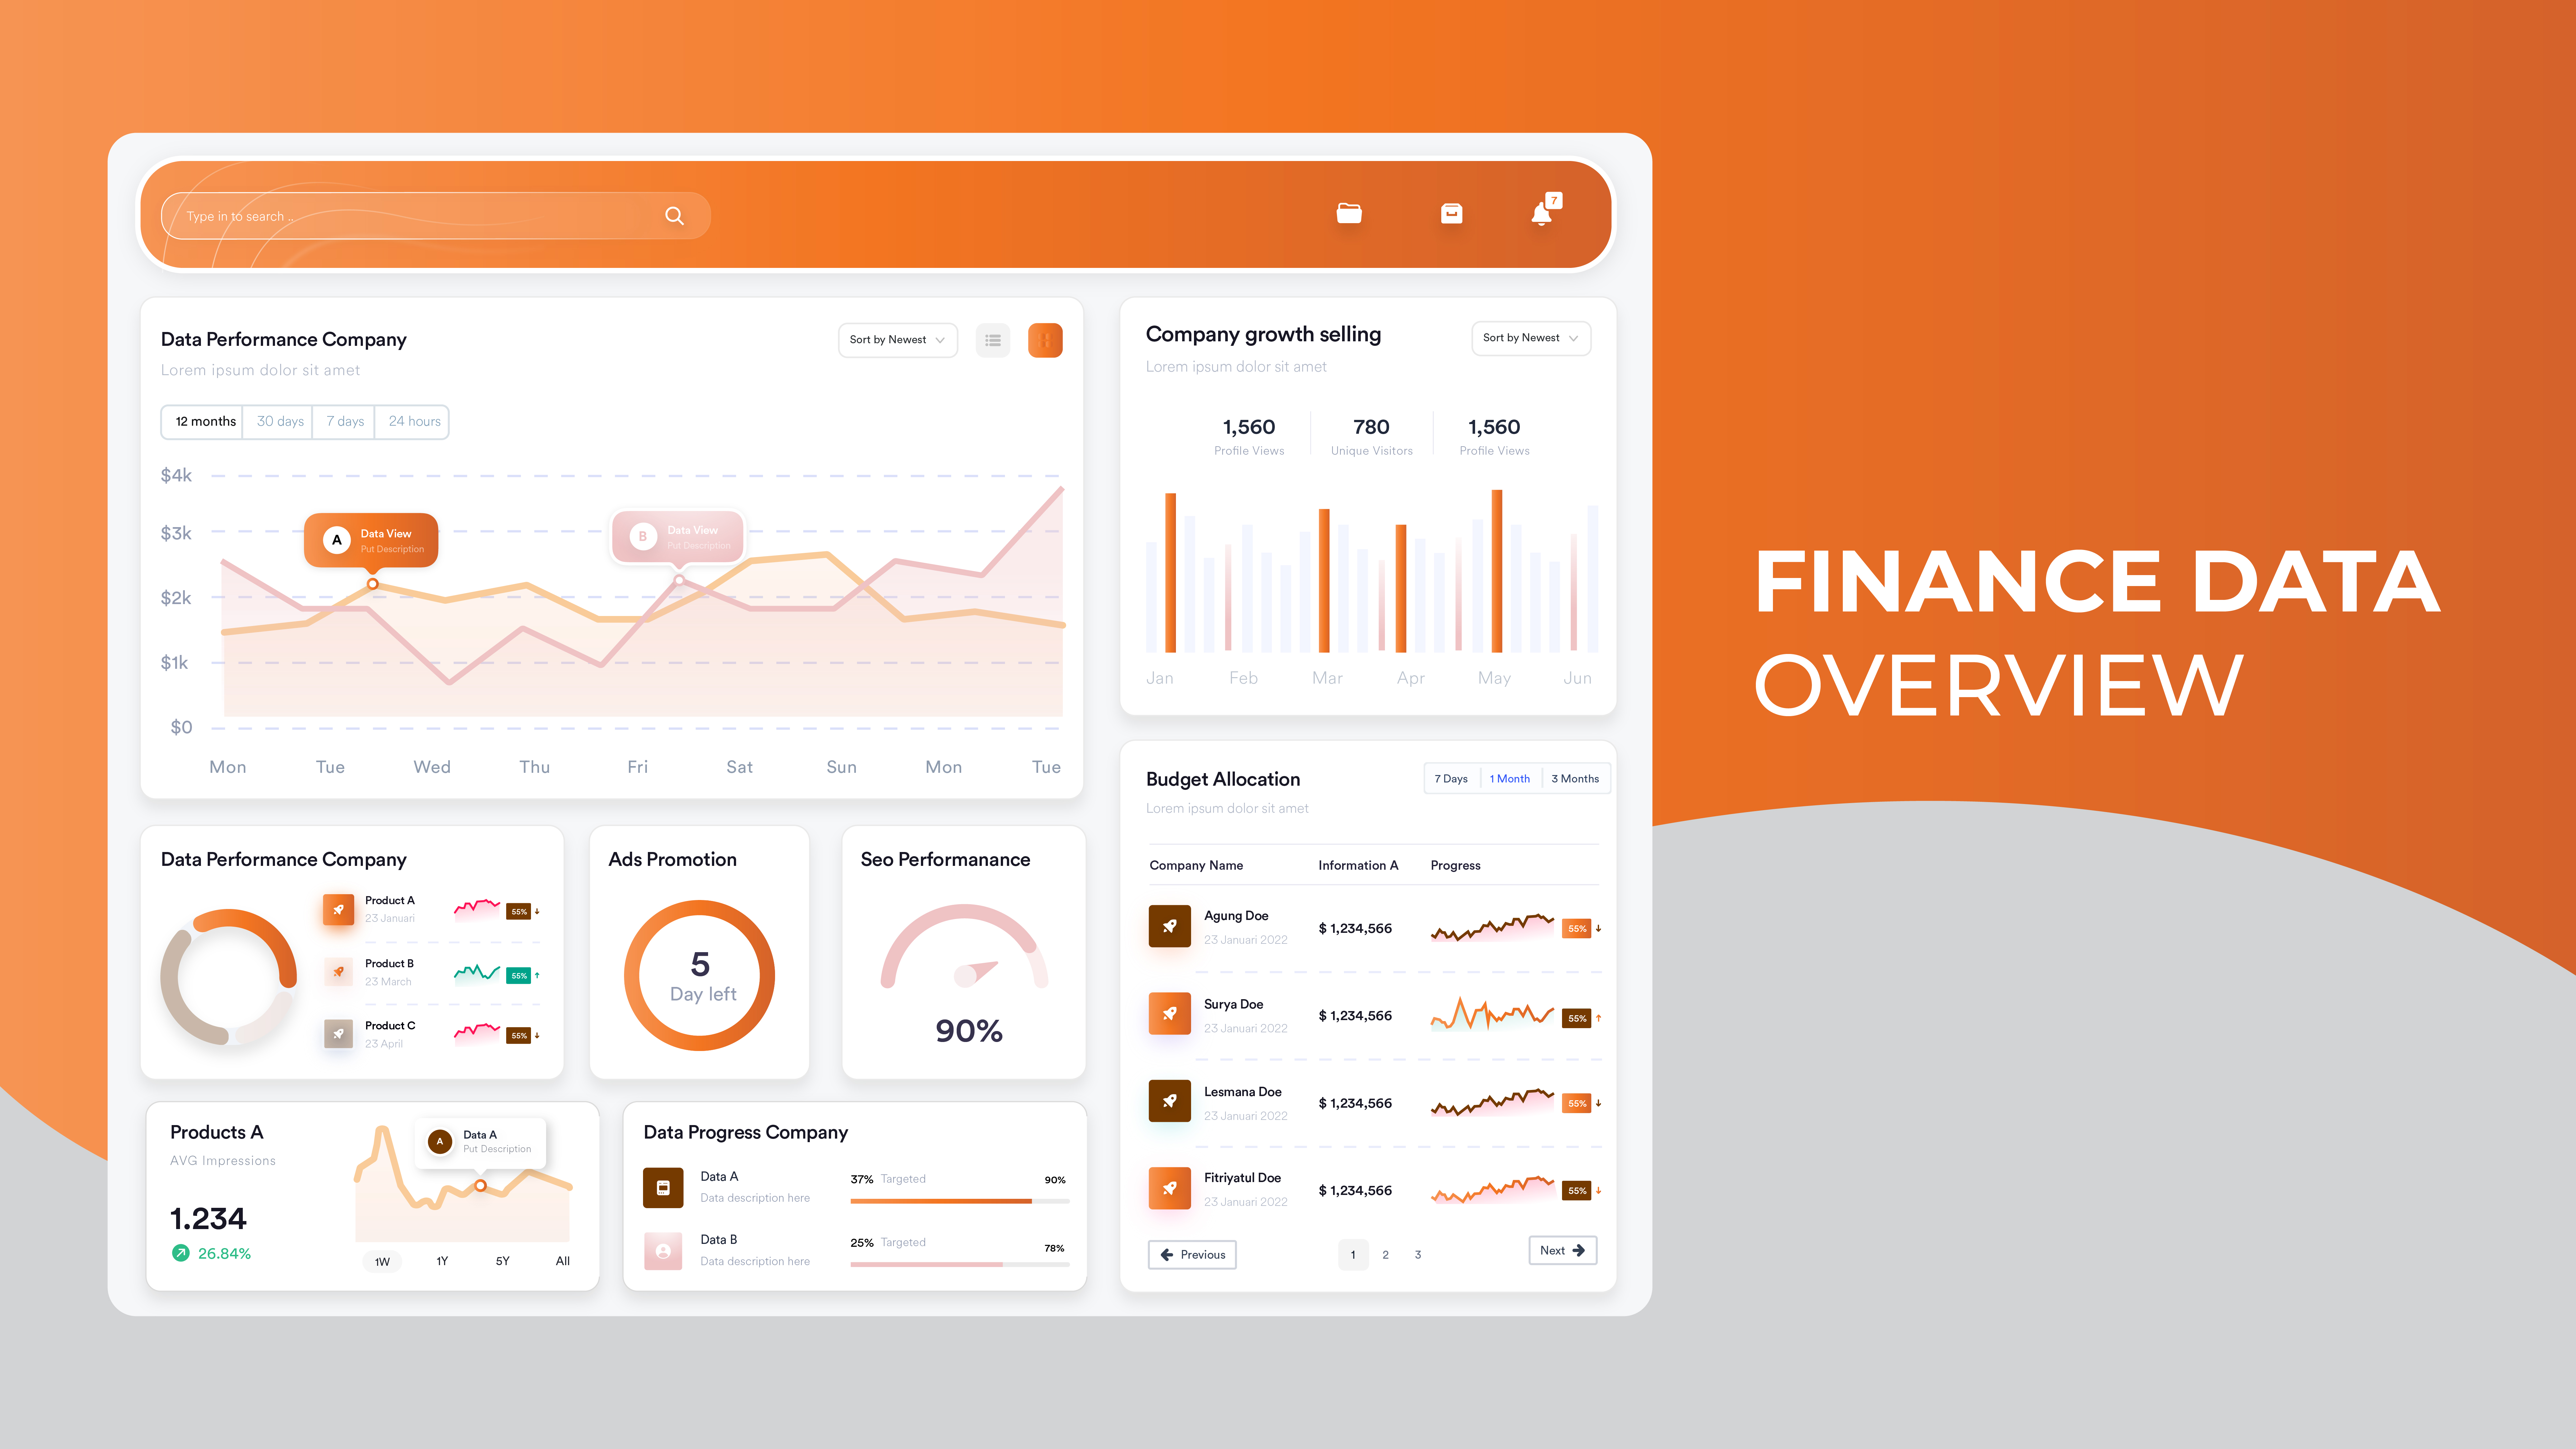
Finance Dashboard overview
Importance of BI for the CFO
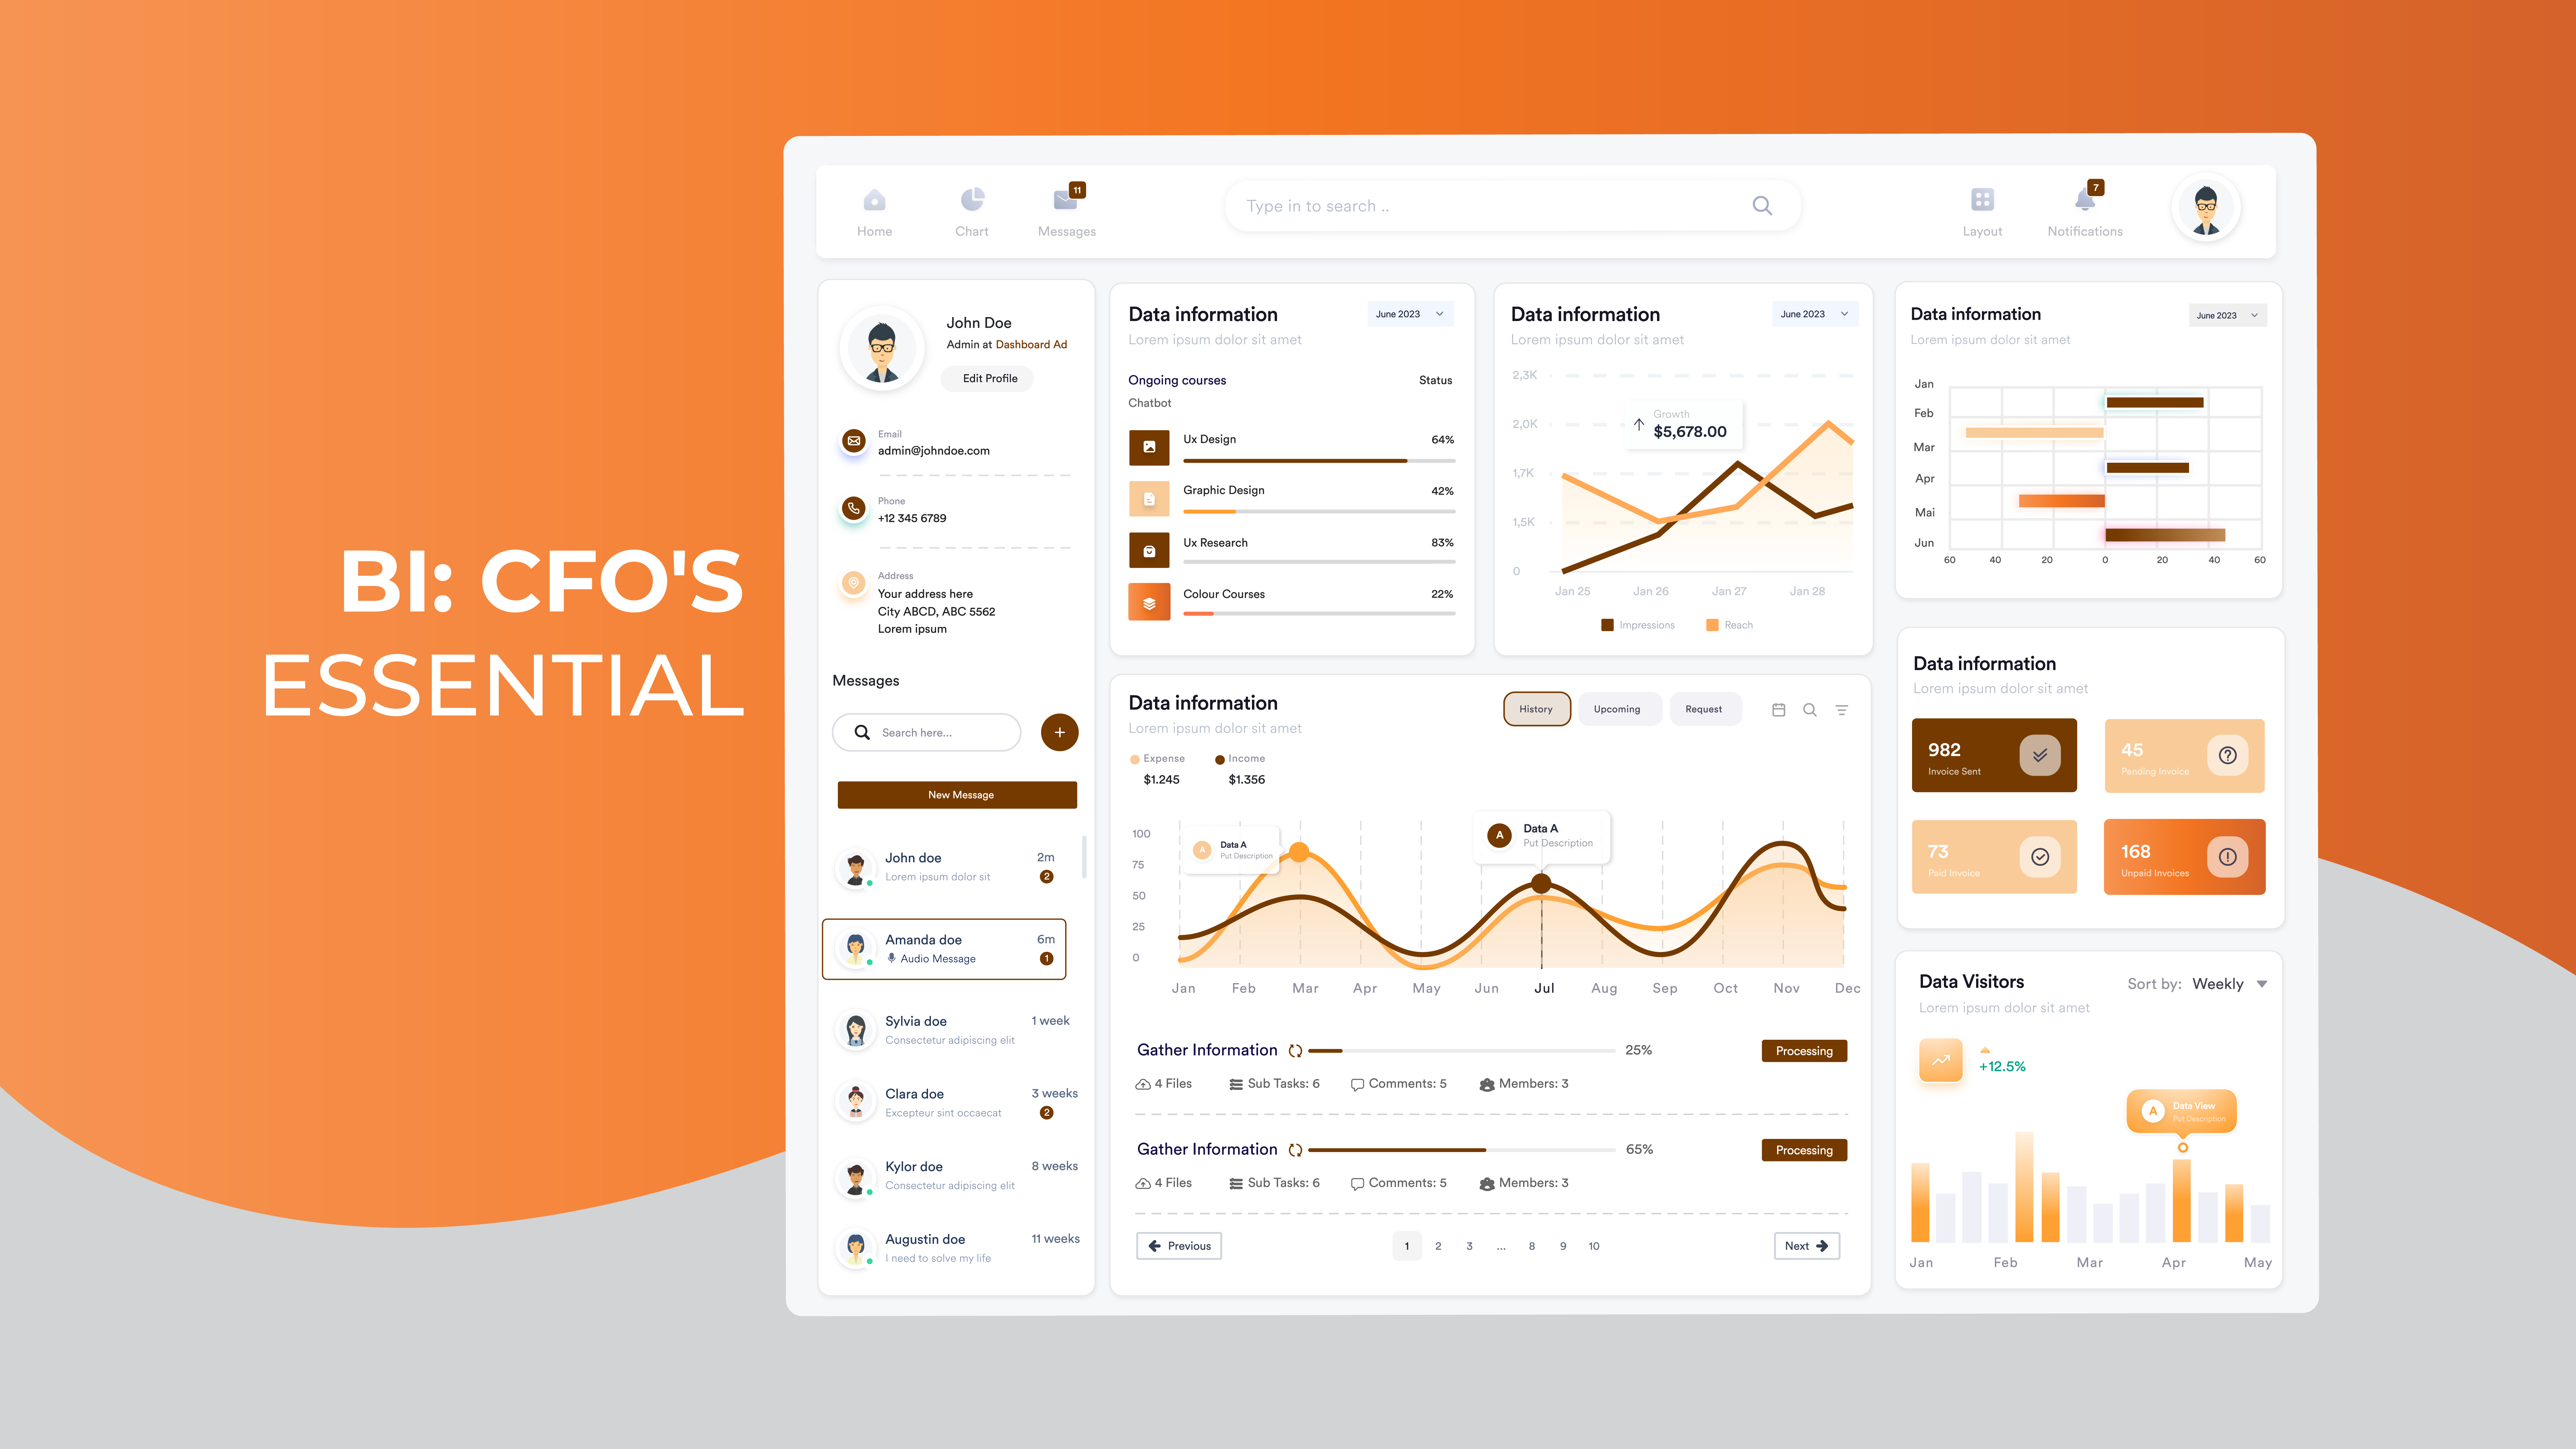
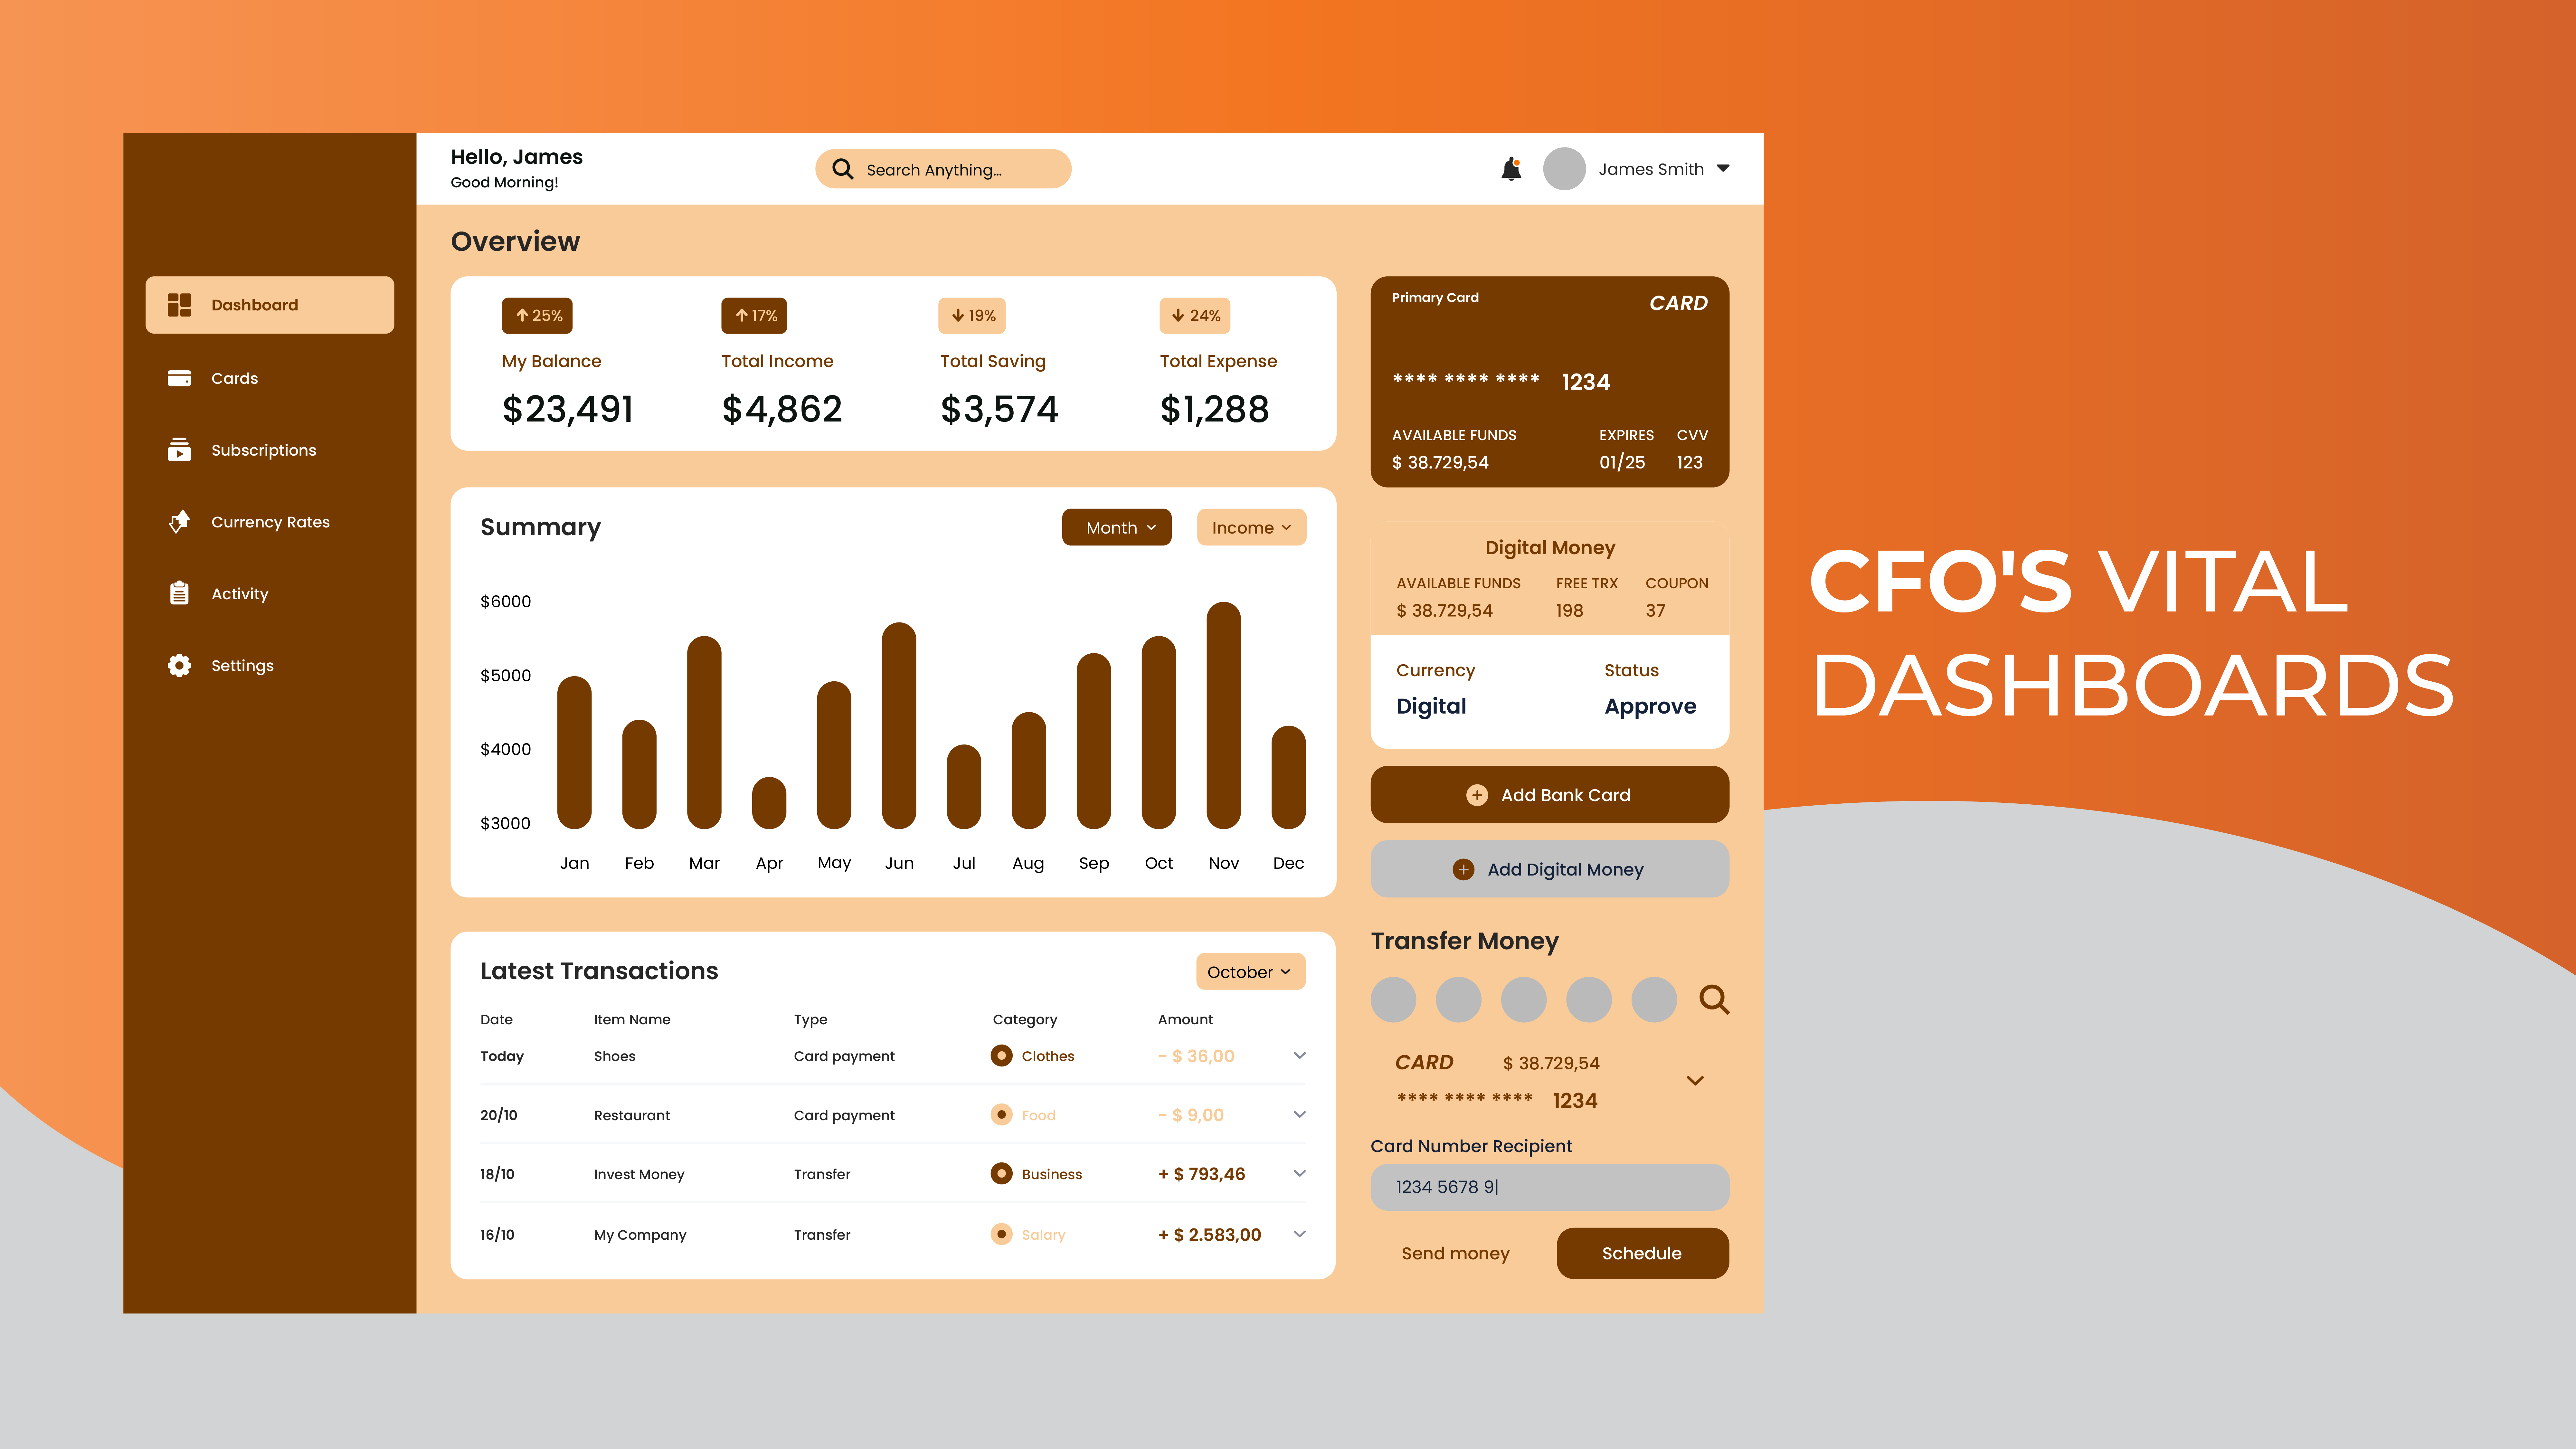
Important Dashboards for the CFO and Finance Team
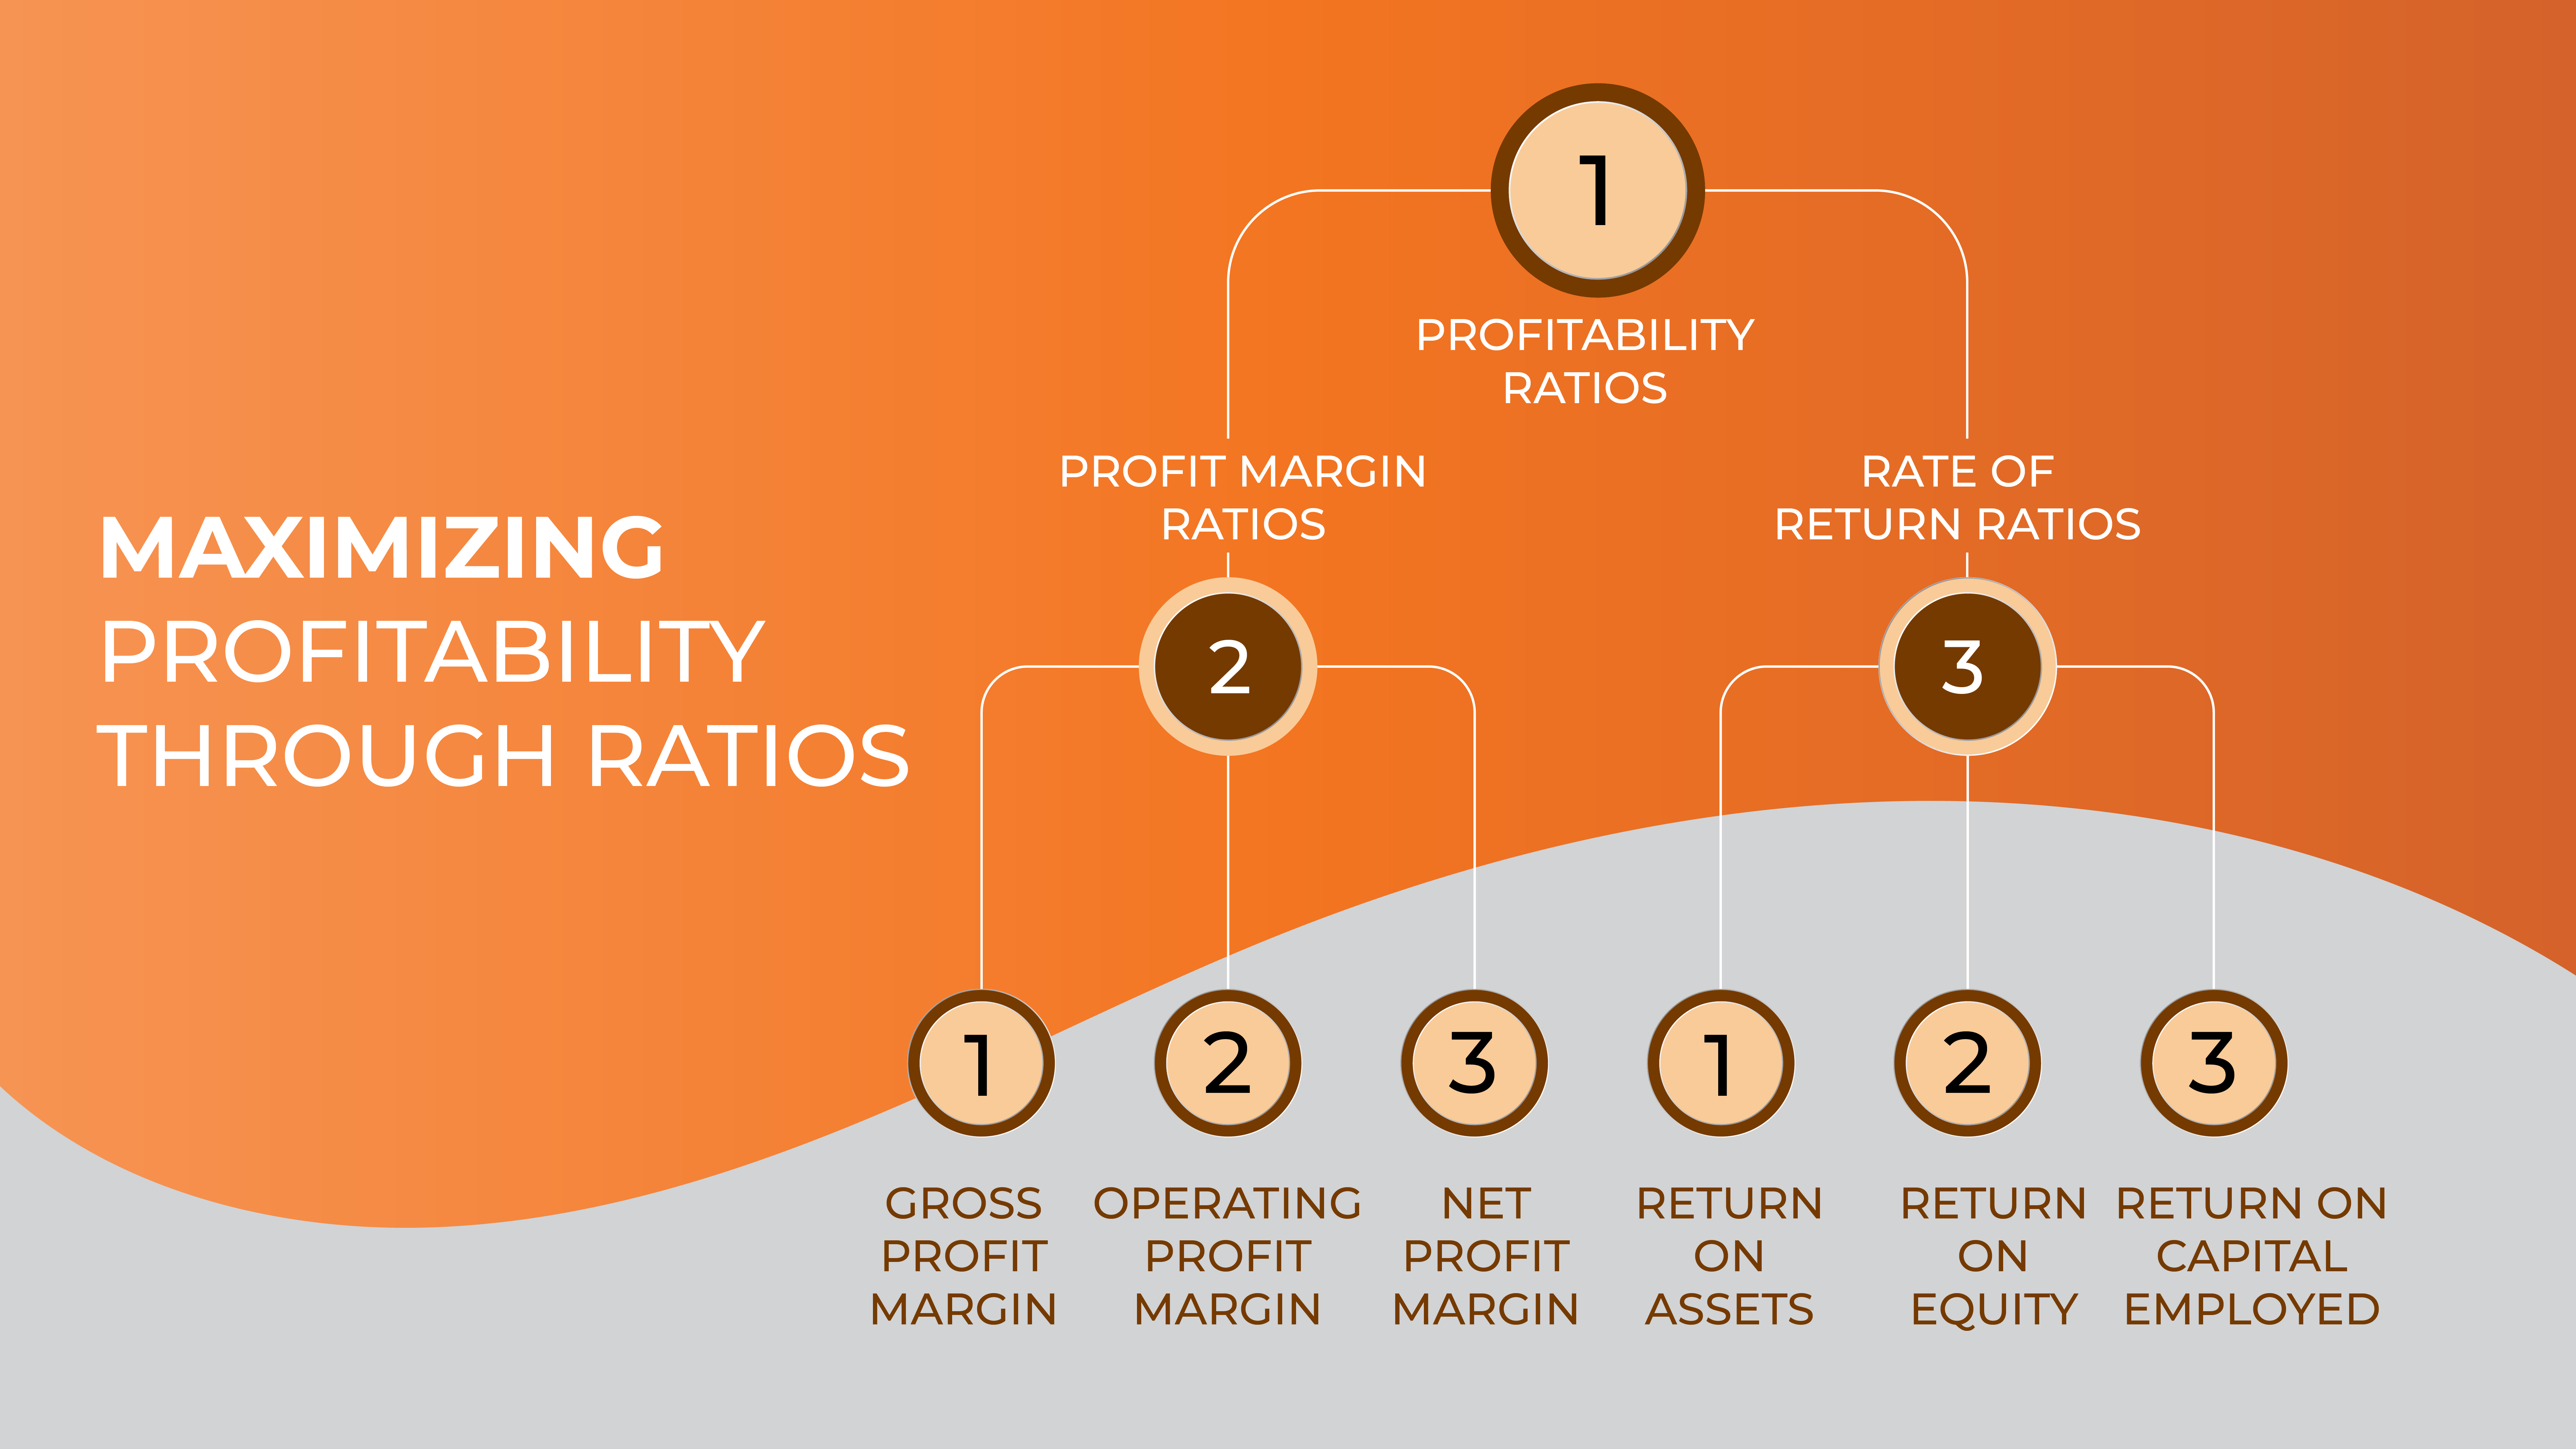
Profitability ratios
